
Building a brand on LinkedIn - whether personal or for your business - can be broken down into 5 distinct stages, each with its own requirements. What works at 500 followers won't work at 5,000. What matters at 2,000 followers becomes irrelevant at 10,000.
In this comprehensive guide, we'll explore each stage of LinkedIn brand building and the analytics that matter at each step. You'll learn exactly what to track, how to interpret the data, and most importantly - how to act on it.
Stage 1: The Foundation (0-500 followers)
The hardest part isn't getting followers. It's figuring out what you should be talking about.
Most people approach LinkedIn backwards. They start posting random content, then try to figure out what worked. But by analyzing your engagement patterns early, you can fast-track your growth significantly.
What to Track at This Stage
-
Theme Performance
-
Track which topics generate the most reactions
-
Monitor which posts spark conversations
-
Note the type of comments you receive (questions, agreements, debates)
-
-
Basic Engagement Patterns
-
Average reactions per post type
-
Comment-to-reaction ratio
-
Share velocity (how quickly posts get shared)
-
How to Use This Data
The goal at this stage isn't to go viral. It's to find your sweet spot - the intersection between what you're knowledgeable about and what your audience responds to.
For example, if you're a software agency owner, you might notice that posts about project management get more engagement than technical deep-dives. Or that stories about client interactions perform better than abstract business advice.
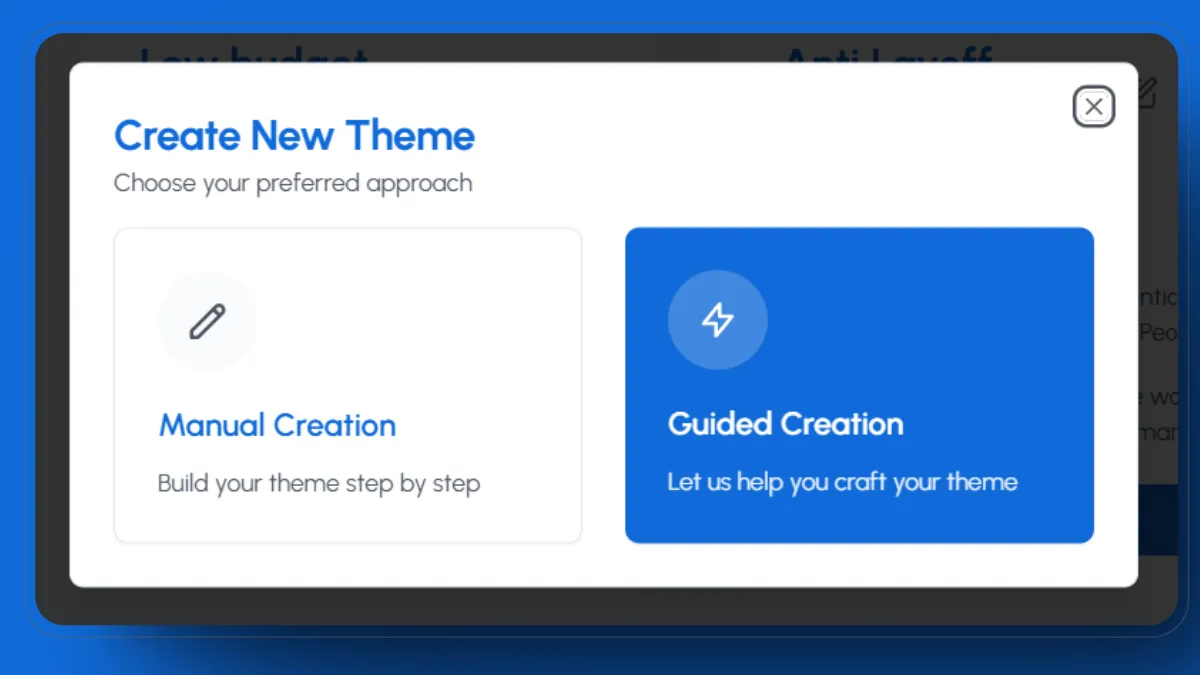
This is where LiGo's guided questionnaire becomes invaluable. Instead of throwing content at the wall, you can:
-
Answer a few targeted questions about your expertise and goals
-
Get recommended content themes based on your answers
-
Generate ideas within those themes
-
Create a month's worth of posts in one sitting
The key is to use these early analytics to validate your content direction before scaling up.
Action Steps for Stage 1
-
Set up 2-3 content themes based on your expertise
-
Generate 30 days worth of posts (about 15-20 posts)
-
Track the performance of each theme
-
Double down on themes that show promise
Stage 2: Consistency Building (500-2000 followers)
Once you've found your themes, the next challenge is maintaining a consistent presence without burning out. This is where most LinkedIn brands falter - they can't sustain their initial momentum.
What to Track at This Stage
-
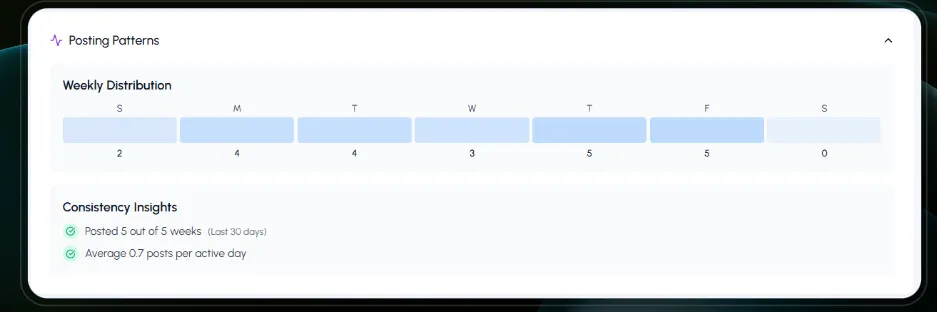
Posting Patterns
-
Weekly streak (number of weeks you've posted consistently)
-
Posts per week average
-
Days with highest engagement
-
-
Time-Based Performance
-
Engagement by day of week
-
Optimal posting times (2-hour chunks)
-
Time to first engagement
-
LiGo's analytics dashboard shows you exactly when your posts perform best. But here's the key insight many miss: The best posting time isn't when most people are online - it's when your engaged audience is active.
Understanding Engagement Quality
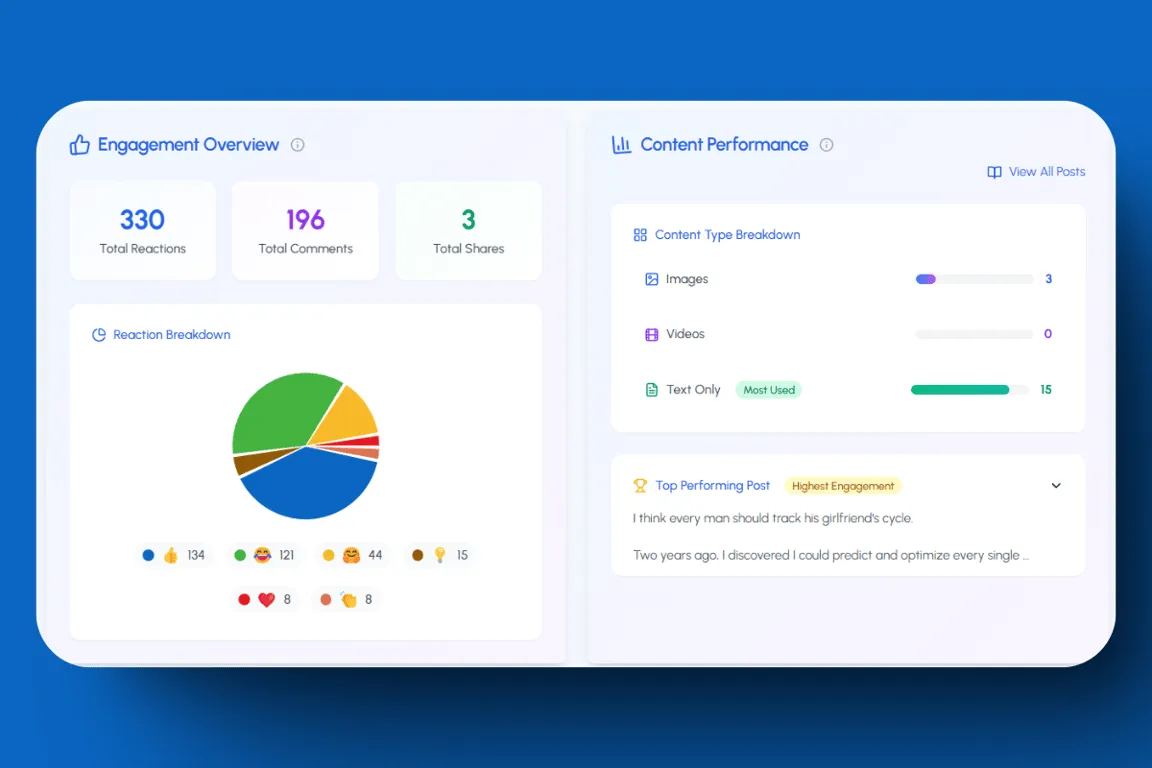
At this stage, you need to look beyond just numbers. LiGo's analytics breaks down your engagement into meaningful patterns:
-
Reaction Types
-
Regular likes vs. other reactions
-
Ratio of thoughtful reactions (insightful, celebrate)
-
Pattern changes over time
-
-
Comment Analysis
-
Length of comments
-
Response patterns
-
Engagement clusters
-
Making Data-Driven Decisions
The goal now is to build a sustainable posting rhythm. LiGo helps you:
-
Generate ideas aligned with your best-performing themes
-
Create multiple post variations
-
Build a content buffer for consistent posting
-
Track performance patterns to optimize timing
Pro tip: While LiGo offers scheduling, we recommend using the "Publish Now" feature or manual posting during your identified peak times. LinkedIn's algorithm tends to favor real-time posts over scheduled content.
Stage 3: Engagement Optimization (2000-5000 followers)
Reaching 2000 followers marks an interesting transition. Your content now regularly sparks discussions, and you're starting to see patterns in how your audience engages. This is when analytics become your secret weapon for deeper audience connections.
Moving Beyond Surface Metrics
The quality of engagement matters more than the quantity at this stage. LiGo's analytics dashboard reveals fascinating patterns in how your audience interacts with your content. You might discover that your text-only posts about client success stories consistently outperform your image posts about industry trends. Or that posts published on Wednesday mornings generate twice the meaningful discussions compared to other times.
These insights shape your content strategy. For instance, one of our agency clients noticed their longer posts (around 1300 characters) generated significantly more thoughtful comments than their shorter updates. They adjusted their content mix accordingly, leading to a 40% increase in comment quality.
The Power of Strategic Engagement
As your audience grows, managing engagement becomes more complex. This is precisely why we built the LiGo Chrome extension. Imagine browsing LinkedIn and having AI-powered suggestions for meaningful comments ready at your fingertips, all aligned with your established content themes and expertise.
Your own engagement on others' posts becomes a powerful tool for community building. The extension helps you maintain authentic interactions at scale, ensuring your comments add value rather than just noise.
Stage 4: Community Building (5000-10,000 followers)
At 5000 followers, you're no longer just creating content – you're cultivating a community. The analytics at this stage tell a more sophisticated story about your audience's interests and behaviors.
Content Themes and Community Dynamics
Remember those initial content themes you established? Now they evolve based on your community's response. LiGo's analytics might reveal unexpected connections – perhaps your posts about team management resonate strongly with your technical content audience, suggesting an opportunity to blend these themes.
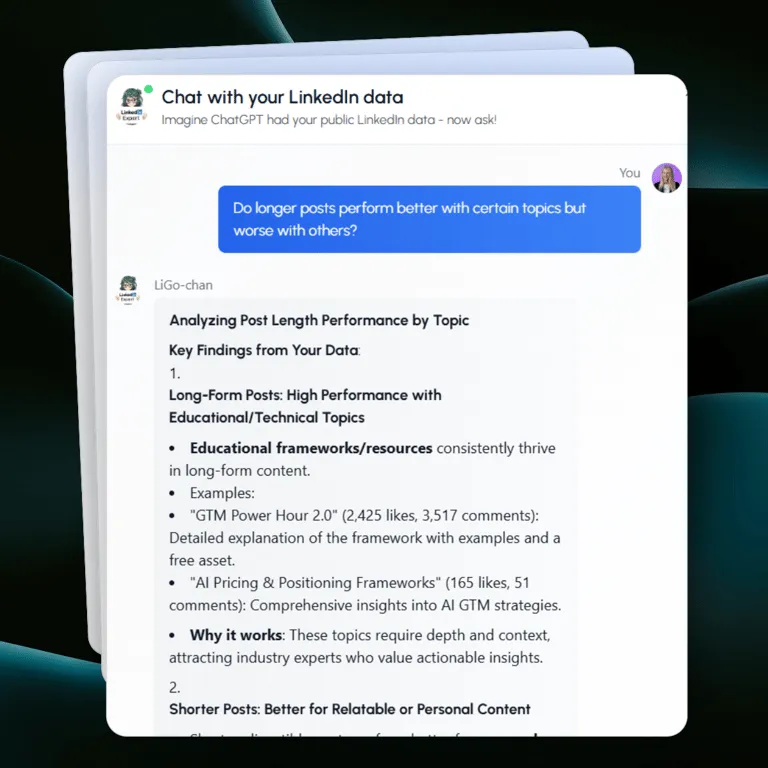
This is where LiGo's AI chat feature becomes invaluable. Instead of just looking at numbers, you can ask specific questions about your content performance:
"How has my audience's response to technical topics changed over the last three months?"
The AI analyzes your historical data and provides actionable insights.
Read our detailed guide on using LiGo's AI Linkedin Strategist to its full potential.
The Art of Content Expansion
Expanding your content themes without diluting your message requires a delicate balance. One software agency owner discovered through LiGo's analytics that introducing a new theme about remote team culture actually strengthened engagement on their core technical posts. The data showed their audience valued the holistic perspective on software development.
The key is monitoring how different themes interact. LiGo's analytics reveal these relationships, helping you craft a content strategy that feels cohesive rather than scattered. You might find that alternating between technical insights and leadership lessons maintains higher engagement than focusing exclusively on either.
Stage 5: Brand Authority (10,000+ followers)
Crossing the 10,000 follower mark changes the game entirely. Your content now reaches far beyond your immediate network, and each post has the potential to spark industry-wide conversations.
The Multiplier Effect
One of our agency clients put it perfectly:
At 10,000 followers, every post becomes a mini-event. It's not just about the content anymore – it's about the conversations that follow. The real value is in the compound effect of these discussions.
This multiplier effect shows up clearly in LiGo's analytics. A single well-crafted post can generate:
-
Primary engagement (direct reactions and comments)
-
Secondary discussions (comment threads and shares)
-
Network amplification (engagement from extended networks)
-
Content echoes (references in others' posts)
Data-Driven Content Mastery
At this stage, LiGo's AI chat becomes your strategic partner. Instead of just tracking metrics, you're now identifying trends before they become obvious. Ask the AI about subtle patterns in your data:
"Show me posts where the comment quality exceeded the average for my technical content."
"Which content themes are driving the most shares from industry leaders?"
"How has the engagement pattern changed for my case study posts over the last quarter?"
The insights often surprise even experienced creators. For instance, one software agency discovered their "behind-the-scenes" development posts were generating more meaningful discussions than their polished case studies – a insight that reshaped their entire content strategy.
The Analytics Advantage
Your analytics dashboard now tells a deeper story. Let's break down what matters most:
Engagement Evolution Track how your content sparks different types of discussions. LiGo's analytics show you the mix of:
-
Industry debates
-
Knowledge sharing
-
Experience exchanges
-
Professional networking
Content Synergy Understanding how different posts work together becomes crucial. A technical post followed by a leadership insight might perform better than either would alone.
Moving Forward: Advanced LinkedIn Strategy
Building a LinkedIn brand isn't a linear journey – it's a series of expanding circles. Each stage builds on the previous one, creating a compound effect that accelerates growth.
The Three Principles of Sustainable Growth
-
Consistency Compounds Numbers tell the story: Accounts that maintain a steady posting rhythm (tracked through LiGo's streak analytics) see 3-4x more engagement growth than sporadic posters.
-
Quality Over Quantity A fascinating pattern emerges in the data: Posts that generate meaningful discussions consistently outperform "viral" posts in terms of long-term audience growth.
-
Strategic Automation The key is automating the right things. Use LiGo to:
-
Generate ideas aligned with your themes
-
Create multiple post variations
-
Analyze performance patterns
-
Engage authentically at scale
The goal isn't to remove the human element – it's to amplify it. Let AI handle the heavy lifting so you can focus on genuine connections."
- A LiGo power user managing multiple agency accounts
Building Your Content Engine
Think of your LinkedIn presence as a content engine. Each component needs to work in harmony:
Foundation: Your established themes and voice
↓
Fuel: Regular content ideas from LiGo
↓
Output: Consistent, high-quality posts
↓
Feedback: Analytics-driven optimization
↓
Growth: Expanding reach and engagement
Each stage of growth presents new opportunities and challenges. The key is having the right tools and insights to adapt your strategy as you evolve. Whether you're just starting out or managing a thriving community, LiGo's analytics and AI features grow with you, helping you make data-driven decisions at every step.
Using Analytics to Guide Your Journey
Every successful LinkedIn brand started at zero. What separates the ones that grow consistently from those that plateau is their approach to data and strategy.
Understanding these five stages of LinkedIn growth – Foundation, Consistency, Engagement, Community, and Authority – gives you a roadmap. But more importantly, it helps you focus on the right metrics at the right time.
A few key takeaways to remember:
When you're starting out, don't get overwhelmed by complex metrics. Focus on finding your themes and validating them through basic engagement patterns.
As you grow, let your analytics guide your content decisions. The data often reveals opportunities that aren't visible on the surface. For instance, topics you might consider "basic" could be exactly what your audience needs to hear from you.
Most importantly, remember that LinkedIn growth isn't about chasing numbers – it's about building meaningful connections through consistent, valuable content. Let tools handle the heavy lifting of content creation and analytics, so you can focus on what matters: authentic engagement with your community.
Ready to start your data-driven LinkedIn journey? Try LiGo free and see how analytics can transform your LinkedIn strategy.
This article is part of our 30-day Linkedin Roadmap. If you are just getting started on Linkedin, then let's start from the beginning:
Linkedin Growth: The Complete Roadmap for 2025
Also featured in Week 4: Linkedin Growth Systems: Building Sustainable Success


