
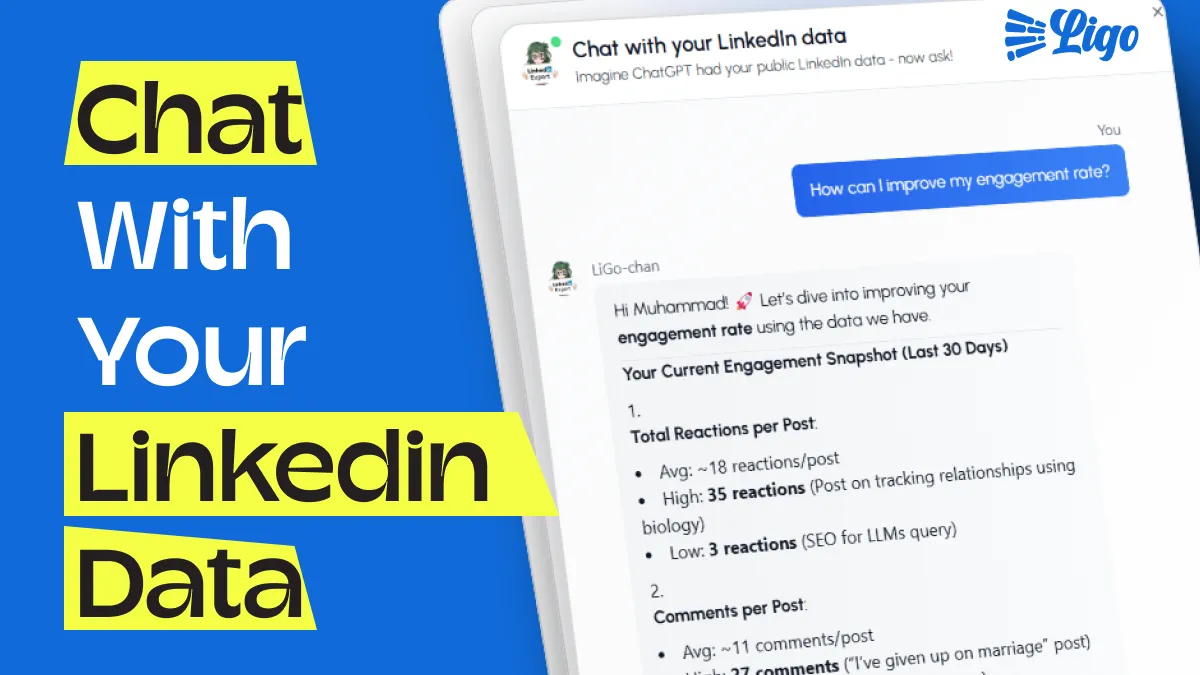
What if you could chat with your LinkedIn data?
Not just look at graphs and numbers, but actually have a conversation about what's working, what isn't, and what you should do next.
Why did my engagement drop last month?"
"Which topics are resonating most with CTOs?"
"How can I improve my content strategy?
These aren't hypothetical questions anymore. With LiGo Analytics and its AI assistant LiGo-chan, they're conversations you can have every day about your LinkedIn performance.
The Problem with Traditional LinkedIn Analytics
Most analytics tools are glorified spreadsheets. They show you what happened, but not why it happened. They give you numbers, but not narratives. They describe your past but don't guide your future.
You know the drill: You open your analytics dashboard, see a spike in engagement from two weeks ago, and... then what? You're left wondering what caused it, how to replicate it, or if it even matters in the long run.
That's where LiGo-chan comes in.
Meet LiGo-chan: Your AI LinkedIn Strategist
LiGo-chan isn't just another AI chatbot. It's a LinkedIn strategist that knows your entire LinkedIn journey-every post you've made, every pattern in your engagement, every trend in your growth.
What makes LiGo-chan different?
First, there's the depth of analysis. When you ask LiGo-chan about your performance, it doesn't just look at recent data. It analyzes your entire LinkedIn history, identifying patterns you might have missed and understanding what truly works for your audience.
Here's a real example:
Your technical deep-dives receive 47% more comments from CTOs when published mid-week. However, your case studies and success stories see higher engagement on Mondays, when decision-makers are planning their week.
That's not just data-that's a strategy you can act on.
The Power of Context
Traditional analytics might tell you that posts with images perform better. LiGo-chan tells you that your specific image posts perform better when they're:
-
Breaking down complex topics
-
Posted during business hours
-
Accompanied by detailed explanations in the comments
The difference? LiGo-chan understands context. It knows that "better performance" might mean more comments for one user and more profile visits for another.
Real-time intelligence
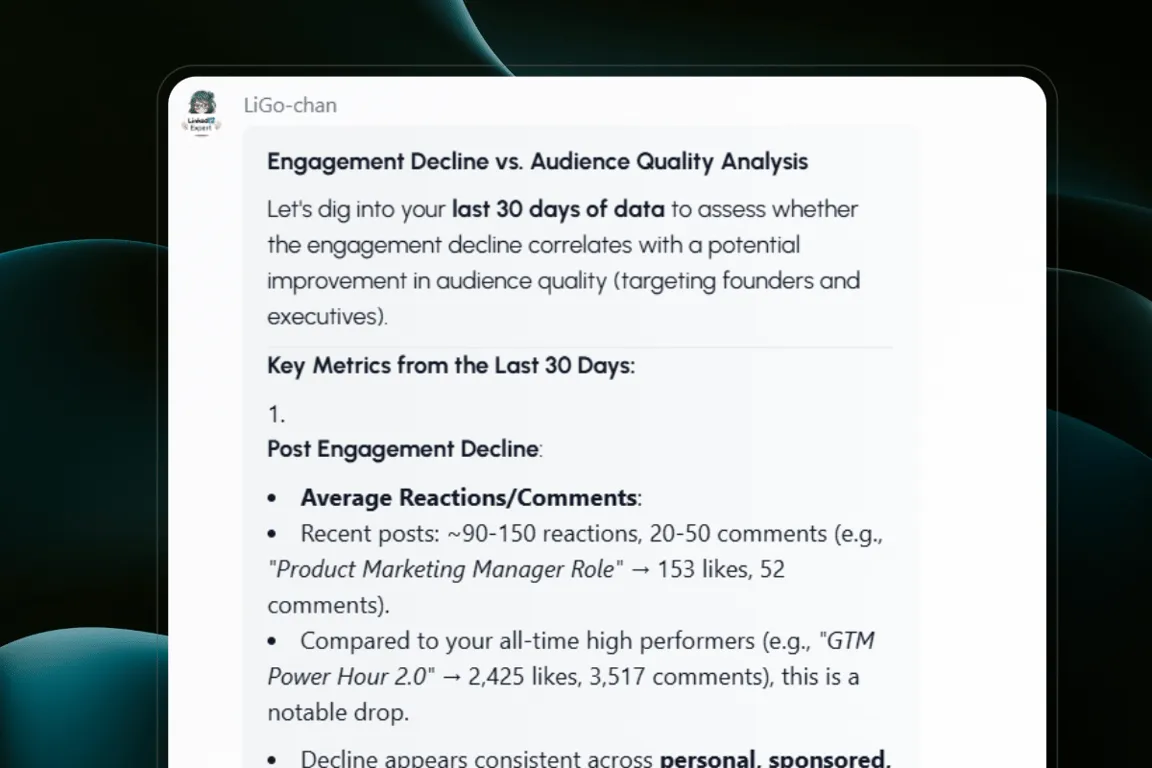
As your analytics dashboard updates with new data, LiGo-chan's insights evolve. Ask about your recent performance drop, and it might say:
While your overall engagement is down 12% this month, comments from your target audience (CTOs and Technical Directors) have increased by 23%. This suggests your content is reaching a more focused, relevant audience.
How LiGo-chan Works With Your Analytics Dashboard
Think of LiGo Analytics as a powerful telescope, and LiGo-chan as the astronomer who helps you understand what you're seeing. The dashboard gives you the complete picture; LiGo-chan helps you interpret it and decide what to do next.
Some of my favorite questions to ask LiGo-chan:
"What content themes drive the most meaningful conversations?"
LiGo-chan analyzes not just engagement numbers, but the quality and source of engagement.
"How has my content strategy evolved over the past quarter?"
Get insights into your changing focus areas and their impact.
"What opportunities am I missing with my current posting schedule?"
Discover untapped potential in your LinkedIn strategy.
Beyond Basic Analytics
In the sections that follow, we'll explore each part of the LiGo Analytics dashboard and show you how to use LiGo-chan to extract maximum value from your data. You'll learn how to:
-
Turn engagement metrics into content strategies
-
Transform timing data into optimal posting schedules
-
Convert audience insights into business opportunities
Understanding Your Data Foundation
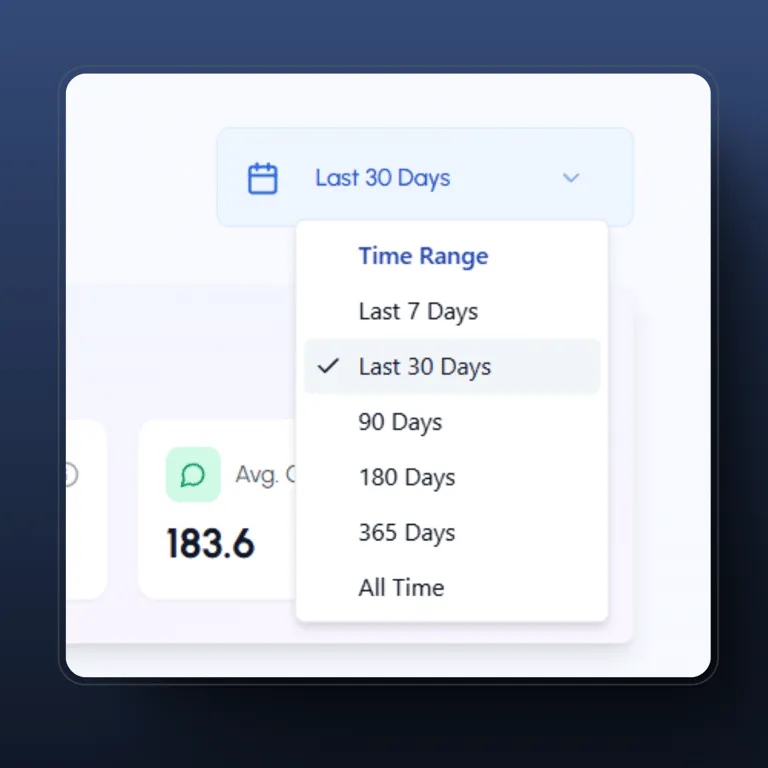
The first step to mastering LinkedIn analytics is understanding how to look at your data across different time periods. It's like zooming in and out of a map-each view reveals something different about the terrain.
LiGo Analytics gives you multiple time windows: 7 days, 30 days, 90 days, 180 days, 365 days, and all-time data. Each tells a different story.
Here's why this matters:
-
30-day view shows your current momentum. It's great for spotting what's working right now, but it can be skewed by one viral post or a temporary trend.
-
90-day view reveals your sustainable patterns. This is where you start seeing the real impact of your content strategy changes.
-
365-day view exposes your true north. It shows the big picture, revealing seasonal patterns and long-term trends that shorter timeframes might miss.
LiGo-chan, what's causing the recent spike in my engagement?"
"While your last post about AI got 3x your average engagement, your baseline engagement has actually grown 45% over the last quarter due to more consistent posting about technical architecture. The AI post amplified an existing upward trend rather than creating it.
This is where LiGo-chan shines. Instead of just showing you the numbers, it helps you understand the story behind them. Some revealing questions to ask:
"How has my engagement quality changed compared to last quarter?"
LiGo-chan can analyze whether you're getting more meaningful comments versus just reactions.
"Which content themes show consistent performance across different time periods?"
Identify your truly reliable topics versus temporary hits.
Pro Tip: When analyzing your performance, always cross-reference at least two time periods. If something looks amazing in your 30-day view but disappears in your 90-day view, you might be looking at a trend rather than a strategy.
Audience Intelligence: Quality Over Quantity
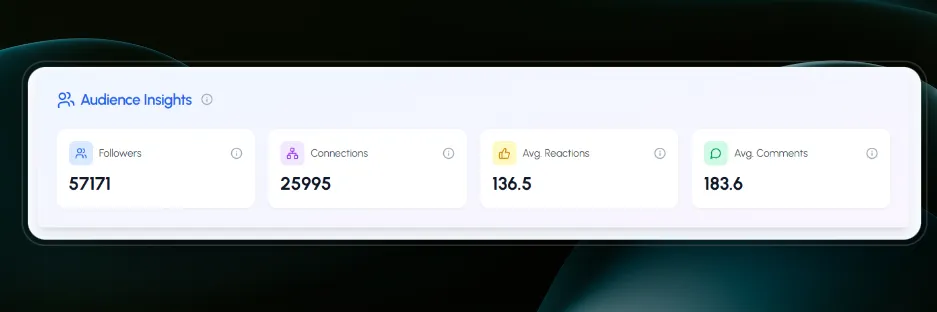
Raw follower counts are the fool's gold of LinkedIn metrics. What matters is who's engaging with your content and how they're engaging with it.
LiGo Analytics shows you the fundamentals: your followers, connections, average reactions, and average comments. But the real magic happens when you click the "Generate AI Insights" button at the bottom of your analytics page.
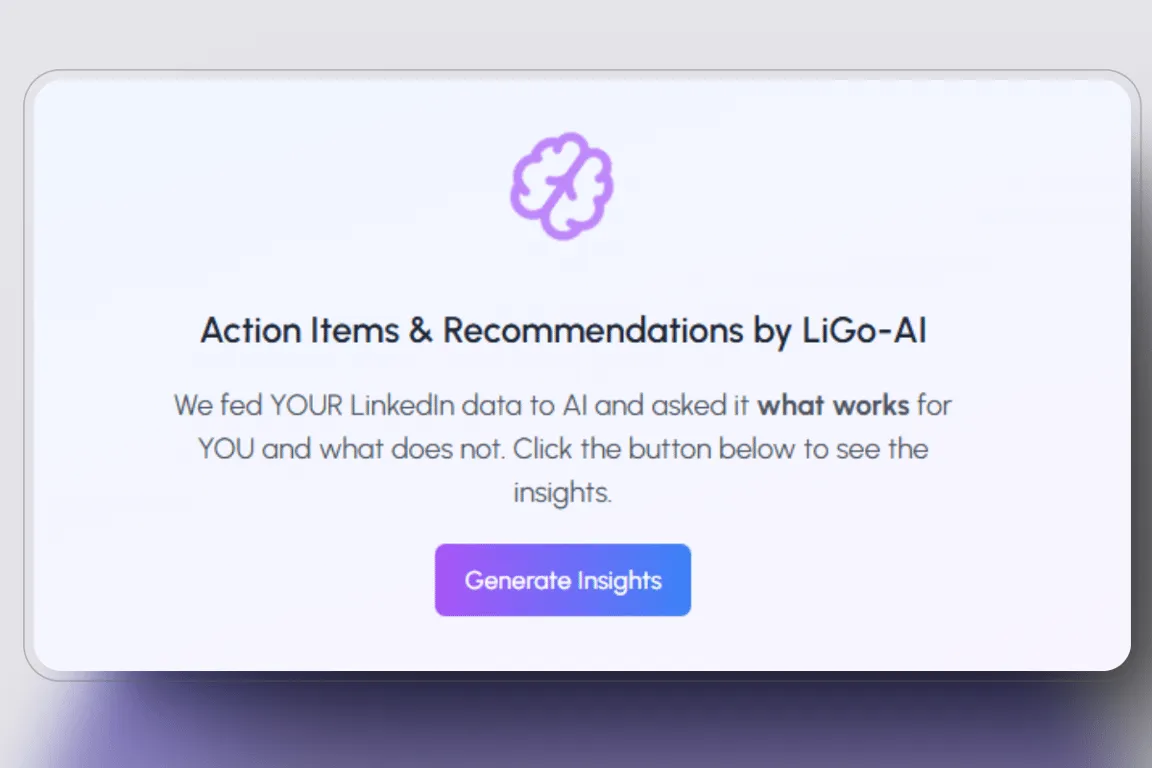
This is where LiGo-chan analyzes your entire engagement history to reveal patterns like:
Your technical posts generate 3x more comments from senior developers and architects compared to your general audience. Moreover, posts that combine practical implementation details with architectural decisions consistently attract CTOs and technical directors.
Beyond Basic Metrics
While the dashboard gives you the numbers, LiGo-chan helps you understand their significance. Ask questions like:
"What patterns do you see in my audience engagement?"
LiGo-chan might reveal that while your overall engagement is steady, meaningful interactions from your target audience are growing.
"How is my content resonating with different audience segments?"
Understand which topics drive deeper engagement with specific professional groups.
Turning Numbers into Strategy
The AI Insights feature analyzes your:
-
Theme and topic performance across audience segments
-
Engagement patterns from different professional groups
-
Content types that drive meaningful professional connections
Real-world example: One of our users discovered through LiGo-chan's AI Insights that while their general audience preferred their how-to content, CTOs and technical directors engaged most with their system architecture breakdowns. This insight helped them create a more targeted content strategy.
The Network Effect
Your LinkedIn network isn't just a number-it's a compound interest machine. Each meaningful connection can exponentially increase your content's reach and impact.
LiGo-chan, how can I improve my network quality?"
"Your posts about cloud architecture attract 3x more engagement from senior technical leaders. Consider expanding this content series while maintaining your current posting frequency of twice per week. Also, your comment responses on technical topics tend to spark longer conversation threads-this is a growth opportunity.
Engagement Deep Dive: Beyond Surface Metrics
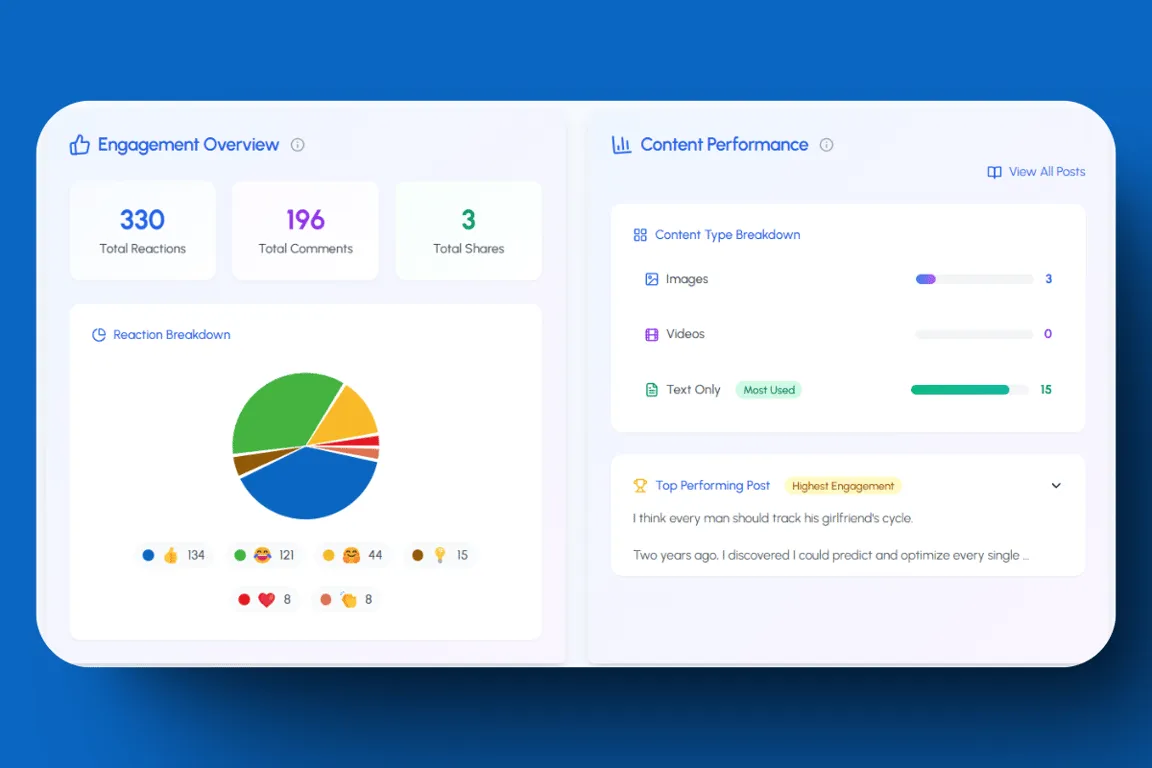
Most people obsess over total engagement numbers. But the real story lives in the patterns-the mix of reactions, the quality of comments, the ripple effects of shares. LiGo Analytics breaks this down into insights you can actually use.
The Engagement Overview
The dashboard shows you three crucial metrics on the left: total reactions, comments, and shares. But it's the breakdown that matters. Your reaction mix tells a story:
The Celebration-to-Like Ratio: When your 'Celebrate' reactions outpace standard likes, you're hitting emotional high notes. This often signals content that resonates on a personal level.
The Insightful Indicator: A high number of 'Insightful' reactions typically correlates with content that drives professional value. These posts often lead to deeper discussions in the comments.
LiGo-chan, what patterns do you see in my highest-performing posts?"
"Your technical breakdowns that start with real-world problems consistently earn more 'Insightful' reactions and spark longer discussion threads. Notably, posts where you respond to comments within the first hour average 2.3x more total engagement.
Content Type Performance
The right side of your dashboard reveals which types of posts dominate your strategy-text, images, or video. But LiGo-chan can tell you why certain types work better:
"Why do my image posts outperform text-only content?"
LiGo-chan might reveal that your images work best when they break down complex concepts, not when they're just decorative.
"What's the optimal mix of content types for my audience?"
Get personalized recommendations based on your historical performance.
Highest Performing Content
Below the overview, you'll find your top-performing post for the selected period. But rather than just showing you the numbers, LiGo-chan can help you understand:
-
What specific elements made it successful
-
How to replicate that success with different topics
-
Whether it represents a repeatable strategy or a one-off spike
Real-world example: A software agency owner discovered through LiGo-chan that their highest-performing posts weren't their most technical ones-they were posts that translated technical concepts for business leaders. This insight completely transformed their content strategy.
Timing & Consistency: The Rhythm of Success
Timing isn't just about finding the "best" time to post-it's about understanding the rhythm of your audience's engagement. LiGo Analytics breaks this down into patterns you can actually use.
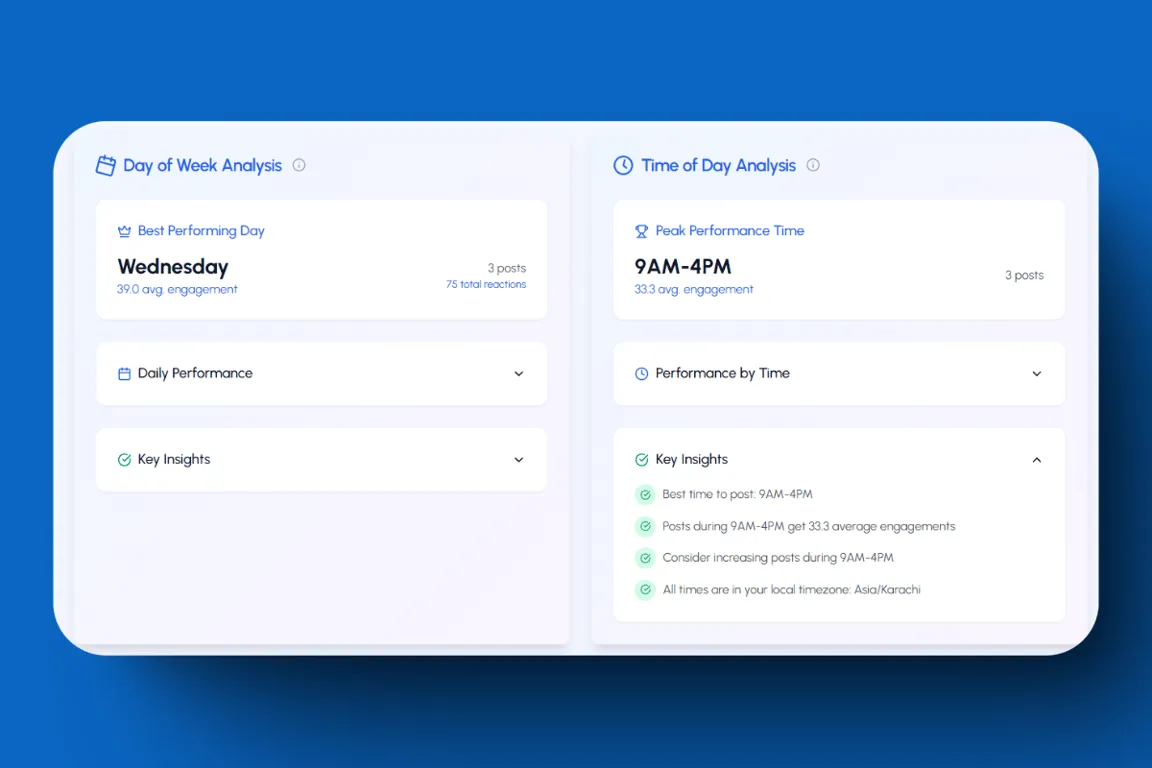
Time Performance Analysis
The dashboard shows your best-performing times in 2-hour blocks across the day. But here's where LiGo-chan adds crucial context:
I notice your technical posts perform 40% better when published between 8-10 AM GMT, while your industry commentary gets more engagement in the afternoon. This aligns with when CTOs and general industry professionals are most active in your network.
Day-by-Day Breakdown
Beyond just showing your "best" day, LiGo Analytics reveals:
-
Consistency Patterns: Your posting frequency visualized across days
-
Engagement Distribution: How different days affect different types of engagement
-
Weekly Rhythms: How your content performs across the business week
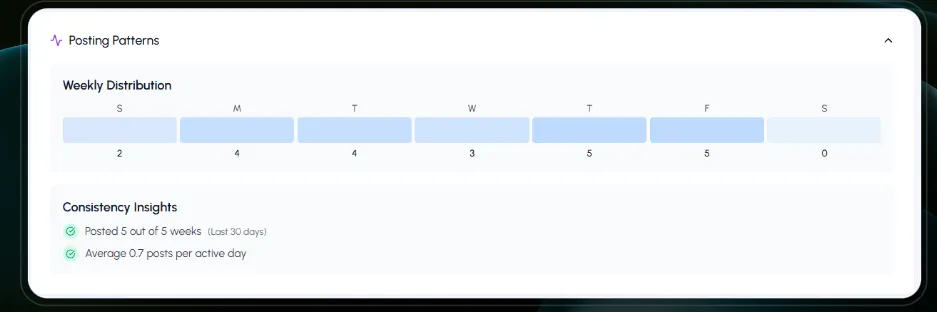
The Consistency Factor
The posting timeline shows three key metrics:
-
Your consistency percentage
-
Current week streak
-
Average posts per week
But LiGo-chan helps you optimize these numbers:
While you're maintaining a strong posting frequency, your engagement peaks when you space posts at least 48 hours apart. This gives each post room to breathe and gather momentum.
Strategic Insights
Ask LiGo-chan questions like:
"How does posting timing affect engagement from different audience segments?"
Understand when your target audience is most receptive.
"What's the optimal posting frequency for my content mix?"
Get personalized recommendations based on your historical performance.
Pro Tip: Don't just look for the highest engagement times-look for the times when you get the most meaningful engagement from your target audience. LiGo-chan can help you spot the difference.
Real-world insight: Through LiGo Analytics, a consulting firm discovered that while their overall engagement was highest on Mondays, their posts about specific technical solutions performed best on Wednesdays-when technical decision-makers were most active.
Content Strategy Insights: Data-Driven Content Decisions
Creating content for LinkedIn isn't about following trends-it's about understanding what resonates with your specific audience. This is where LiGo Analytics moves beyond basic metrics to help you make strategic decisions about your content.
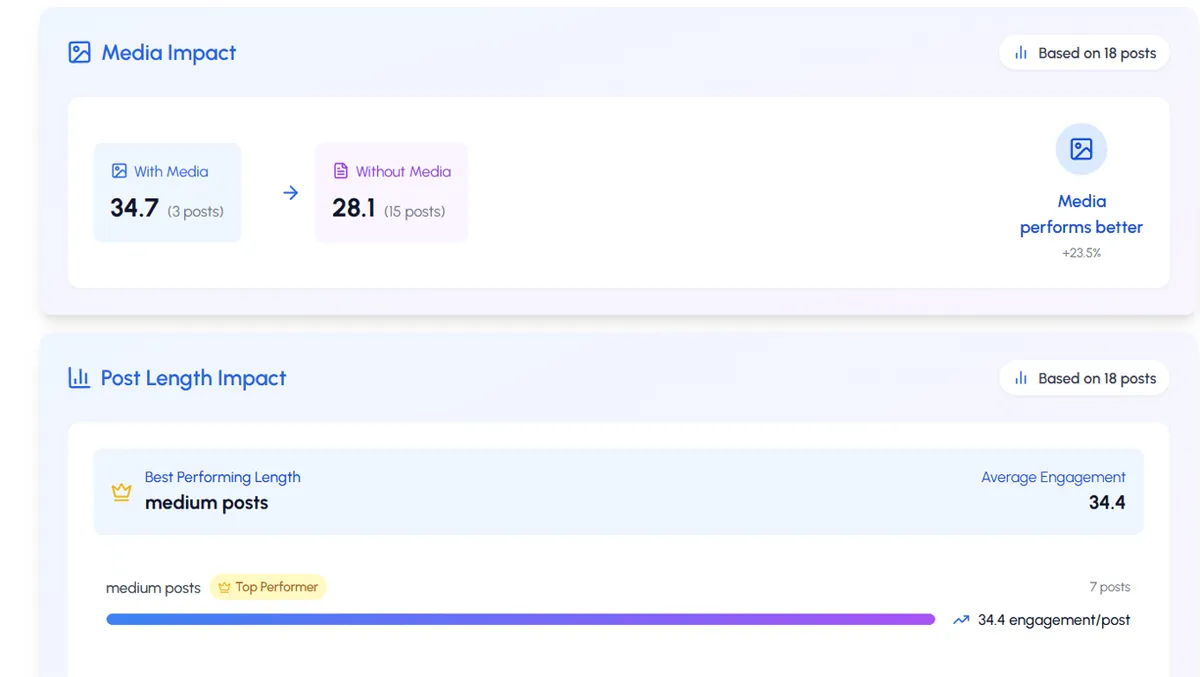
Media Impact Analysis
The dashboard clearly shows whether posts with media outperform text-only posts. But the real value comes from understanding the nuances:
LiGo-chan, when does media actually improve my engagement?"
"While your posts with visuals get 32% more impressions overall, your deep technical analyses perform better as text-only posts. However, when you use diagrams to explain system architecture, engagement from technical leaders increases by 85%.
Insight in Action: A software consulting firm discovered that their code snippets got the most engagement when accompanied by a brief architectural diagram, while their project retrospectives performed better as pure text stories.
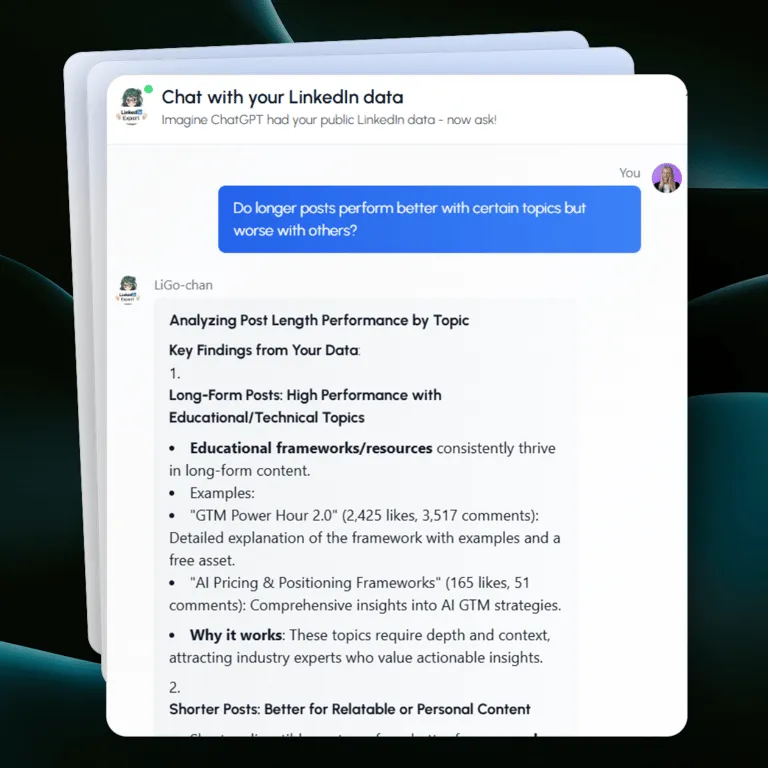
Content Length Performance
The dashboard breaks down how different post lengths perform, but LiGo-chan helps you understand why:
"Why do my longer posts sometimes outperform shorter ones?"
Get insights into which topics deserve more depth and which need concision.
"How does post length affect different types of engagement?"
Understand the correlation between content length and engagement quality.
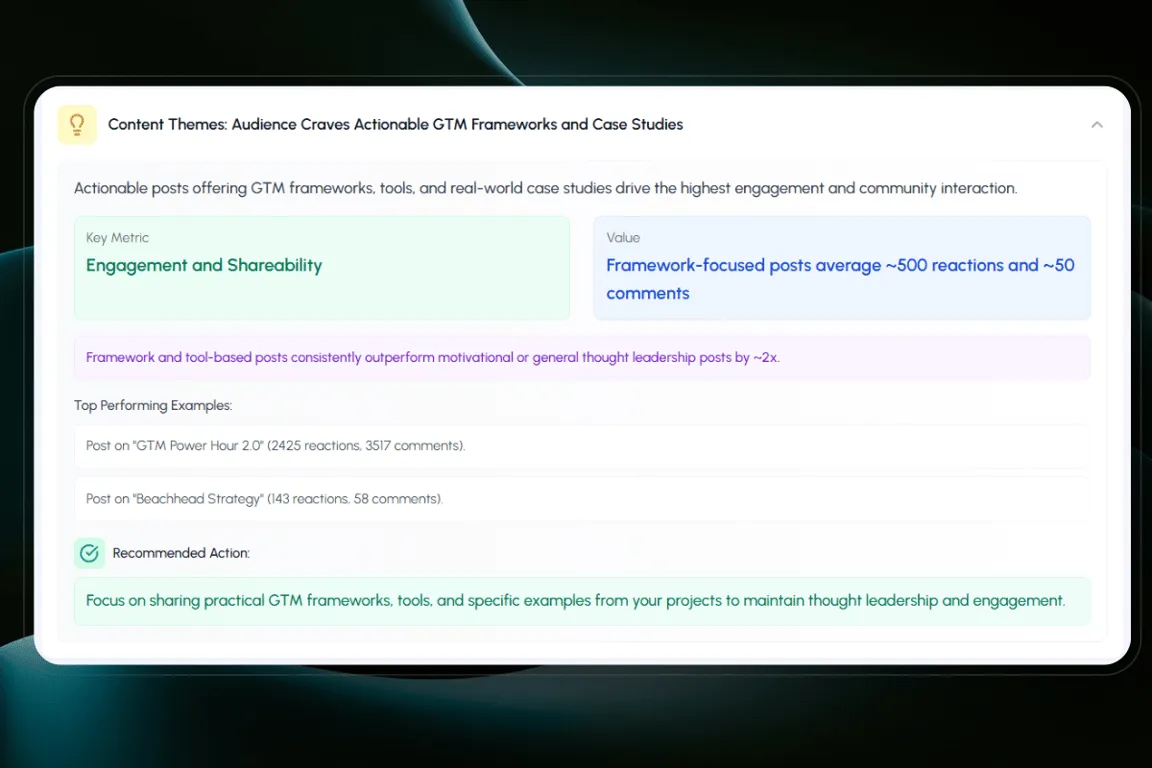
Theme and Topic Analysis
This is where LiGo-chan's AI capabilities truly shine. Beyond basic performance metrics, it can help you understand:
-
Which topics drive meaningful professional conversations
-
How different themes resonate with specific audience segments
-
Where your content sweet spots lie
Your posts about practical implementation challenges get 3x more comments from senior developers, while your architectural decision posts attract more CTOs. Consider alternating between these themes to maintain engagement across your target audience.
AI-Generated Content Insights
At the bottom of your analytics page, you'll find AI-generated insights about:
Posting Time Optimization
Understanding not just when to post, but what type of content works best at different times.
Content Type Effectiveness
Analyzing which formats drive the most meaningful engagement for your specific goals.
Theme Performance Patterns
Identifying which topics consistently resonate with your target audience.
Engagement Pattern Analysis
Understanding the deeper patterns in how your audience interacts with your content.
Growth Trends & Patterns: The Long Game
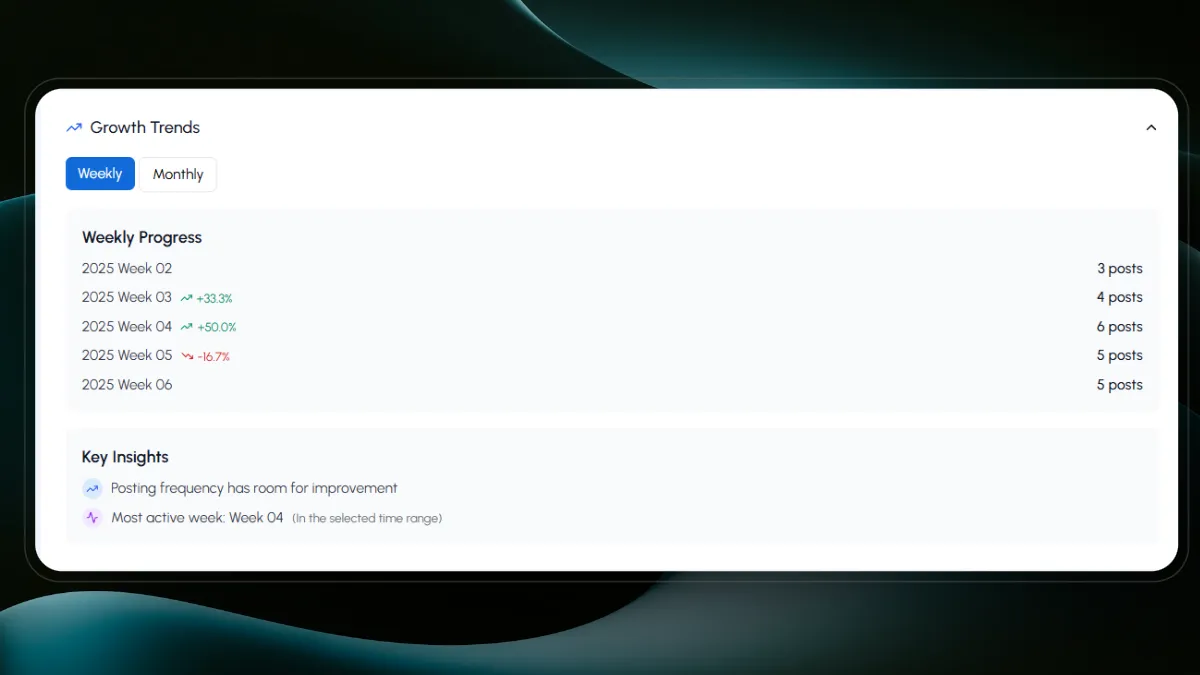
Growing on LinkedIn isn't about viral hits-it's about consistent, meaningful growth. LiGo Analytics helps you track and understand your growth trajectory with context.
Monthly Growth Comparisons
The dashboard shows your month-over-month growth, but LiGo-chan helps you understand the story behind the numbers:
While your follower growth slowed this month, engagement from your target audience (technical decision-makers) increased by 28%. This suggests your content is becoming more focused and effective at reaching the right people.
Consistency Metrics That Matter
Three key metrics tell your consistency story:
-
Consistency percentage
-
Week streak
-
Average posts per week
But the real insights come from LiGo-chan's analysis:
"How has my content consistency affected engagement quality?"
Understand the relationship between posting frequency and meaningful interactions.
"What's the optimal balance between quantity and quality for my audience?"
Get personalized recommendations based on your historical performance.
Activity Heatmap
The activity heatmap visualizes your posting patterns, but LiGo-chan helps you optimize them:
Your current posting pattern shows gaps on Thursdays and Fridays. Given that technical decision-makers engage most with your content mid-week, consider redistributing your Monday posts to these days.
Growth Pattern Analysis
LiGo-chan can help you identify:
-
Which strategies drive consistent growth versus temporary spikes.
-
How your professional network is evolving in terms of relevance and engagement.
-
Where you might be missing chances to expand your influence.
Real-world example: An agency owner used LiGo Analytics to discover that while their total post count decreased after implementing a more strategic posting schedule, their meaningful engagements with potential clients increased by 45%.
Putting It All Together: Your Data-Driven LinkedIn Strategy
The true power of LiGo Analytics isn't in any single feature-it's in how everything works together to transform your LinkedIn strategy from guesswork to science.
The Weekly Review
Start each week with a simple ritual:
LiGo-chan, what are the key insights from last week's performance?
You might discover that your technical deep-dives are gaining traction with a new audience segment, or that your comment engagement has shifted to more meaningful professional discussions.
This isn't just data-it's direction for your next week of content.
The Monthly Strategy Session
Once a month, dive deeper:
-
Review your growth trends across different metrics
-
Analyze your content mix performance
-
Check if your audience composition is evolving as intended
-
Identify new opportunities and adjust your strategy
LiGo-chan can guide this process:
Based on your last 30 days of data, your most engaged audience segment has shifted from general tech professionals to senior architects. Your posts about system design trade-offs are driving this change. Consider expanding this content theme while maintaining your current technical tutorial series.
The Quarterly Reset
Every quarter, take a step back and let LiGo-chan help you understand the bigger picture:
"What content themes have shown consistent growth this quarter?"
Identify your reliable topics versus temporary trends.
"How has my audience engagement evolved?"
Understand if you're building the right kind of influence.
"What new opportunities should I explore?"
Get data-backed suggestions for content expansion.
Making It Work For You
The goal isn't to chase metrics-it's to build meaningful professional influence. Use LiGo Analytics to:
-
Focus on Quality: Let the data guide you toward content that resonates with your target audience, not just what gets the most likes.
-
Stay Consistent: Use the insights to maintain a sustainable posting schedule that works for both you and your audience.
-
Adapt and Grow: Let LiGo-chan help you spot new opportunities and evolve your strategy as your audience grows.
Your Next Steps
-
Start with a baseline analysis of your current performance
-
Set clear goals for what you want to achieve
-
Use LiGo-chan to develop a content strategy that aligns with these goals
-
Monitor, adjust, and optimize based on the insights you receive
You're not just looking at numbers-you're having a conversation with your data through LiGo-chan. Let it guide you toward content that matters, engagement that counts, and growth that lasts.
"The best LinkedIn strategies aren't built on tricks or hacks. They're built on understanding-understanding your audience, your content's impact, and your growth trajectory. That's what we've built LiGo Analytics for."
PS: Have questions about using LiGo Analytics for your specific needs? Connect with us on Linkedin and feel free to shoot a DM.


